How do you read an LLM leaderboard or benchmark table?
Read an LLM leaderboard by checking the task, dataset, metric, model version and test conditions before the rank. Look for uncertainty and possible training-data overlap, then ask whether the test resembles your work. A one-point lead on one benchmark is evidence about that setup, not proof that a model is best for everyone.
Open the photograph at full size
Photograph: Diagram: AI Journey
Read the full description of this diagram
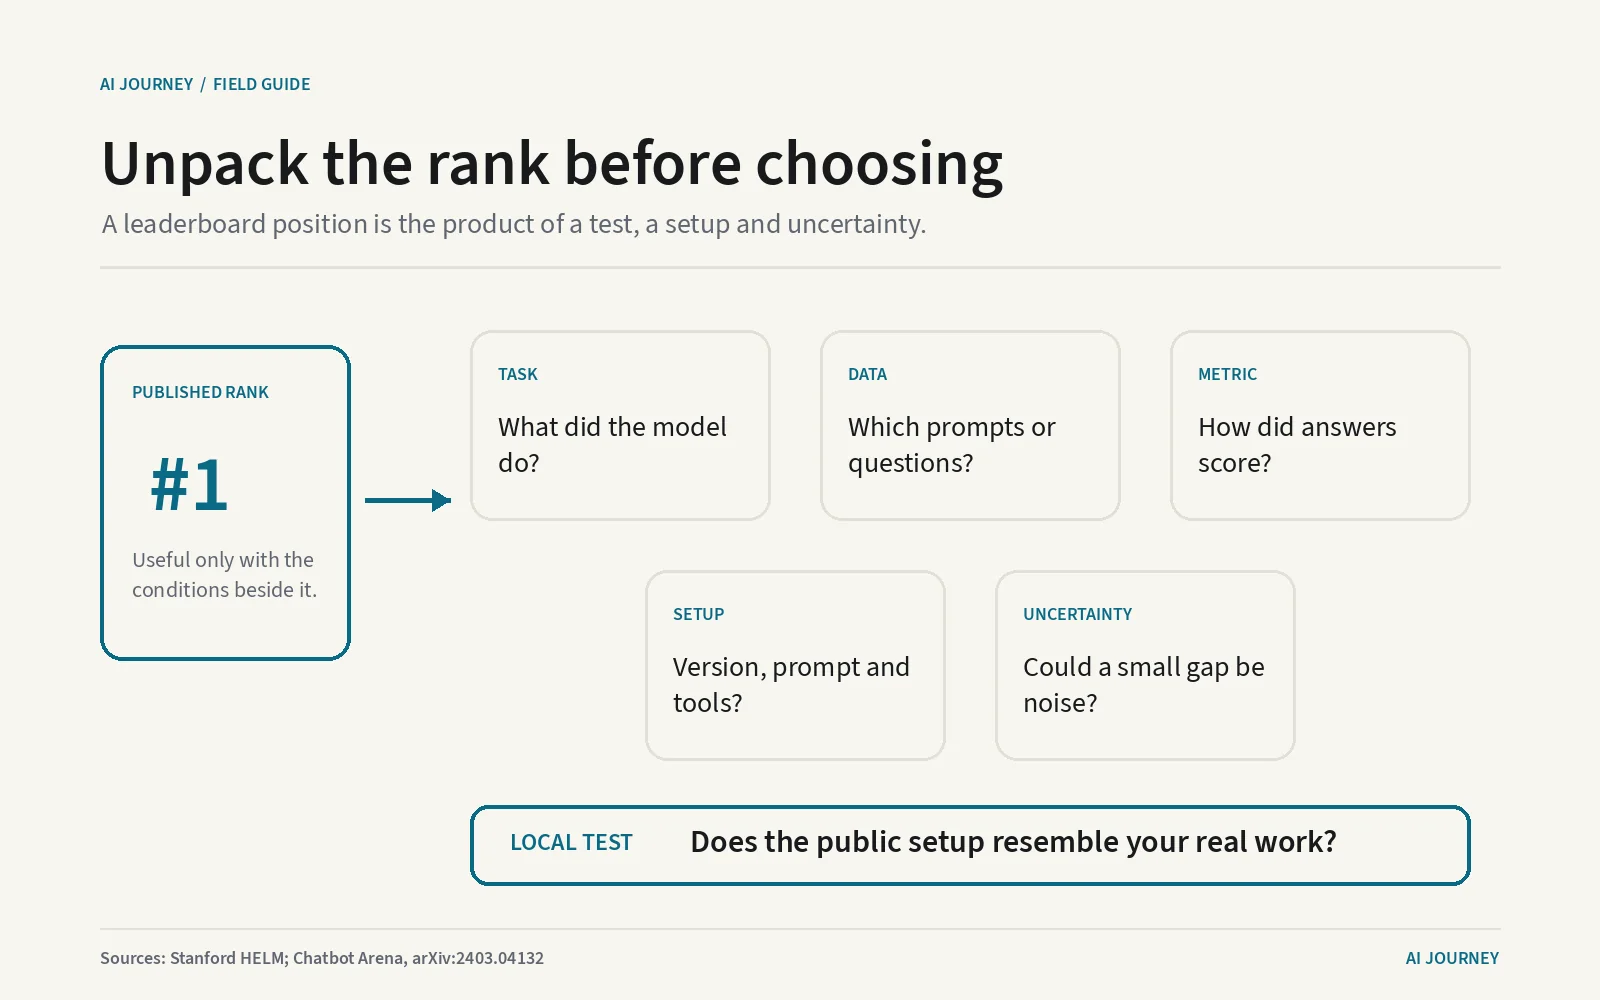
The diagram begins with a large leaderboard rank, then opens it into five evidence cards. Task names what the model attempted. Dataset names the questions or prompts. Metric states how answers became scores. Setup records the model version, prompt and allowed tools. Uncertainty shows whether small differences may be noise. A final arrow points to a local test and asks whether the public setup resembles the reader's real work.
An LLM leaderboard orders models under a particular evaluation. Before trusting the rank, identify the task, test data, scoring rule, exact model and conditions. Then look for uncertainty and ask whether the evaluation resembles your own work. The table can narrow a shortlist. It cannot name a universal best model.
A rank compresses several choices into one number
An LLM, or large language model, generates and analyzes language. A benchmark is a defined test used to compare systems. A leaderboard orders their results. The ranking looks objective because it is numerical, but every number sits on editorial and technical choices.
The test designer chooses a task, such as answering knowledge questions, writing code, summarising documents or following instructions. The dataset is the collection of questions, documents or prompts used. The metric is the rule that turns responses into scores, such as exact-match accuracy, an automated judge or human preference. Change any one and the order can change.
Some boards combine many results into an aggregate score, a single number calculated from several tests. Read how the tests are weighted. A simple average gives a narrow trivia test and a broad reasoning test equal influence if each contributes one number. A hidden or frequently changing mix makes movement hard to interpret.
Stanford’s HELM project was created around a holistic approach: evaluate several scenarios and several metrics, document the setup and expose gaps rather than pretending one score captures everything. That design is a useful reading habit even when the leaderboard is not HELM. Ask what the number leaves out.
Read every benchmark row from left to right
Start with the exact model version and date. “Claude,” “Gemini” or “GPT” is a family, not a stable tested object. A preview, dated snapshot and later production version can differ. Our ChatGPT versus Claude comparison records named products and source dates rather than merging a family into one permanent capability claim.
Next inspect the prompt and allowed tools. Was the model given one example or several? Could it search, run code or retry? Few-shot means the prompt contains a small number of worked examples. Tool-assisted means the model may call software outside its stored parameters. A tool-assisted score should not be compared silently with a closed-book score.
Then read the metric’s direction and unit. Higher accuracy is better; lower error or latency may be better. A percentage-point difference is not the same as a percent improvement. If one model scores 81 percent and another 80 percent, the difference is one percentage point, or 1.25 percent relative to 80.
Look for uncertainty. A confidence interval is a range showing how precise an estimate is under a statistical method. If two ranges overlap substantially, a neat first and second place may imply more certainty than the evidence supports. Repeated runs can also vary when models sample different answers. A table should say whether it used one run, several runs or deterministic settings.
Finally check data contamination, possible overlap between evaluation questions and material used to train or tune a model. A memorized answer can look like general ability. The absence of known overlap is not proof of none, but a benchmark should explain safeguards, test freshness and whether questions are public.
Our guide to reading a model announcement applies this row-by-row method to a vendor launch table.
Human preference and fixed tests answer different questions
Chatbot Arena evaluates models through pairwise human preference. A person sees an anonymous pair of model responses to a prompt and chooses a preferred answer or tie. The original paper describes how these votes are combined with a Bradley-Terry model, a statistical method for estimating relative strength from pairwise outcomes. This can capture qualities that an exact-answer test misses, such as helpfulness or style.
It also reflects who submitted prompts, who voted, which models appeared and when the data was collected. Preference does not establish factual correctness, safety or value for a particular company. A model can win because its answer is more pleasant while both answers contain the same error. The paper discusses statistical validation, but a live rank still needs its current method and sample read beside it.
Fixed tests provide the same questions and a more repeatable scoring rule. They can measure a narrow ability cleanly, but public datasets may age, leak into training or reward formatting tricks. HELM’s multi-metric approach highlights another issue: accuracy is not the only concern. Robustness, calibration, fairness, efficiency and other measures can expose tradeoffs hidden by one column.
Calibration asks whether a model’s expressed confidence matches how often it is correct. Robustness asks whether performance survives reasonable changes to wording or conditions. These terms describe specific tests, not general praise.
Turn a public result into a decision for your work
Use a leaderboard to create a shortlist, then run a local evaluation. Collect representative examples of the work, remove information you cannot send under your data policy, and define a pass rule before seeing model names. Score quality, cost and response time. The API pricing comparison supplies dated prices; the plan comparison applies when people use consumer apps.
Blind the reviewer to model identity where practical. Blinding hides which system produced an answer so brand expectations do not shape the score. Include hard failures, ordinary cases and edge cases. An edge case is an unusual but valid input likely to expose a weakness. Run enough examples that one lucky response cannot determine the purchase.
The company hubs for OpenAI, Anthropic and Google connect model claims to current plans, prices and source pages. Check context needs with the guide to context windows. A model that leads a short-answer board may be wrong for a long-document job if its product limits, price or reliability do not fit.
Do not publish a universal winner from your local test either. State the task, sample, date, model versions and scoring rule. The honest conclusion is “best among these models for this workflow under these conditions.”
What it means for you
When the next leaderboard appears, read five things before the rank: task, dataset, metric, setup and uncertainty. Check whether tools or extra attempts were allowed and whether every model received comparable treatment. Treat tiny gaps cautiously and look for omitted cost, latency and safety measures.
Then ask the decisive question: does this test resemble what you need? If not, the board is discovery, not a decision. Shortlist from public evidence, test on your own representative work and preserve the conditions beside the result. A leaderboard becomes useful when it starts an evaluation, not when it ends one.
Questions people also ask
- What is an LLM benchmark?
- It is a defined test that gives language models the same or comparable tasks and scores their outputs with a stated metric. Its result applies to the tested dataset, model version and setup; it does not measure every kind of useful work.
- What is an Elo score on an AI leaderboard?
- It is a rating inferred from pairwise wins and losses rather than a percentage of correct answers. Chatbot Arena's paper describes a Bradley-Terry statistical model for estimating ratings from human preferences. The result depends on the collected comparisons.
- Does the top-ranked model have to be the best model?
- No. It is top under that leaderboard's prompts, voters, scoring and date. Cost, speed, tool use, privacy, language and your task may produce a different choice. Close scores may also be too uncertain to support a meaningful order.
Where these numbers come from
Every figure on this page was read from the pages below on the dates shown, and nothing here is taken from another publisher's article. When a vendor changes a number on this page, the change is logged in what changed in AI and the page is corrected with a new date.
Published by Kawsar. How this site collects and checks data.